IntelliJ IDEA Configuration for java-tron
To simplify the Java development process and improve efficiency, selecting and configuring an Integrated Development Environment (IDE) is a crucial first step. This guide uses IntelliJ IDEA as an example to explain how to set up and configure the java-tron development environment.
java-tron nodes support deployment on Linux or MacOS operating systems. The JDK version requirements are as follows:
- On x86_64 architecture, currently only JDK 8 (latest minor version recommended) is supported.
- On arm64 architecture, currently only JDK 17 is supported.
The following configuration uses x86_64 architecture and JDK 8 (latest minor version recommended) as an example.
Prerequisites
Before you begin, please ensure your development environment meets the following requirements:
- Operating System:
LinuxorMacOS - JDK 8 (latest minor version recommended) is installed
gitis installed- IntelliJ IDEA is installed
Configuring the IntelliJ IDEA Environment
Step 1: Install the Lombok Plugin
Lombok simplifies Java code through annotations and is an essential plugin for java-tron development.
- Open IntelliJ IDEA and navigate to
Preferences->Plugins. - In the Marketplace tab, search for
Lombok. - Click "Install" and restart the IDE when prompted.
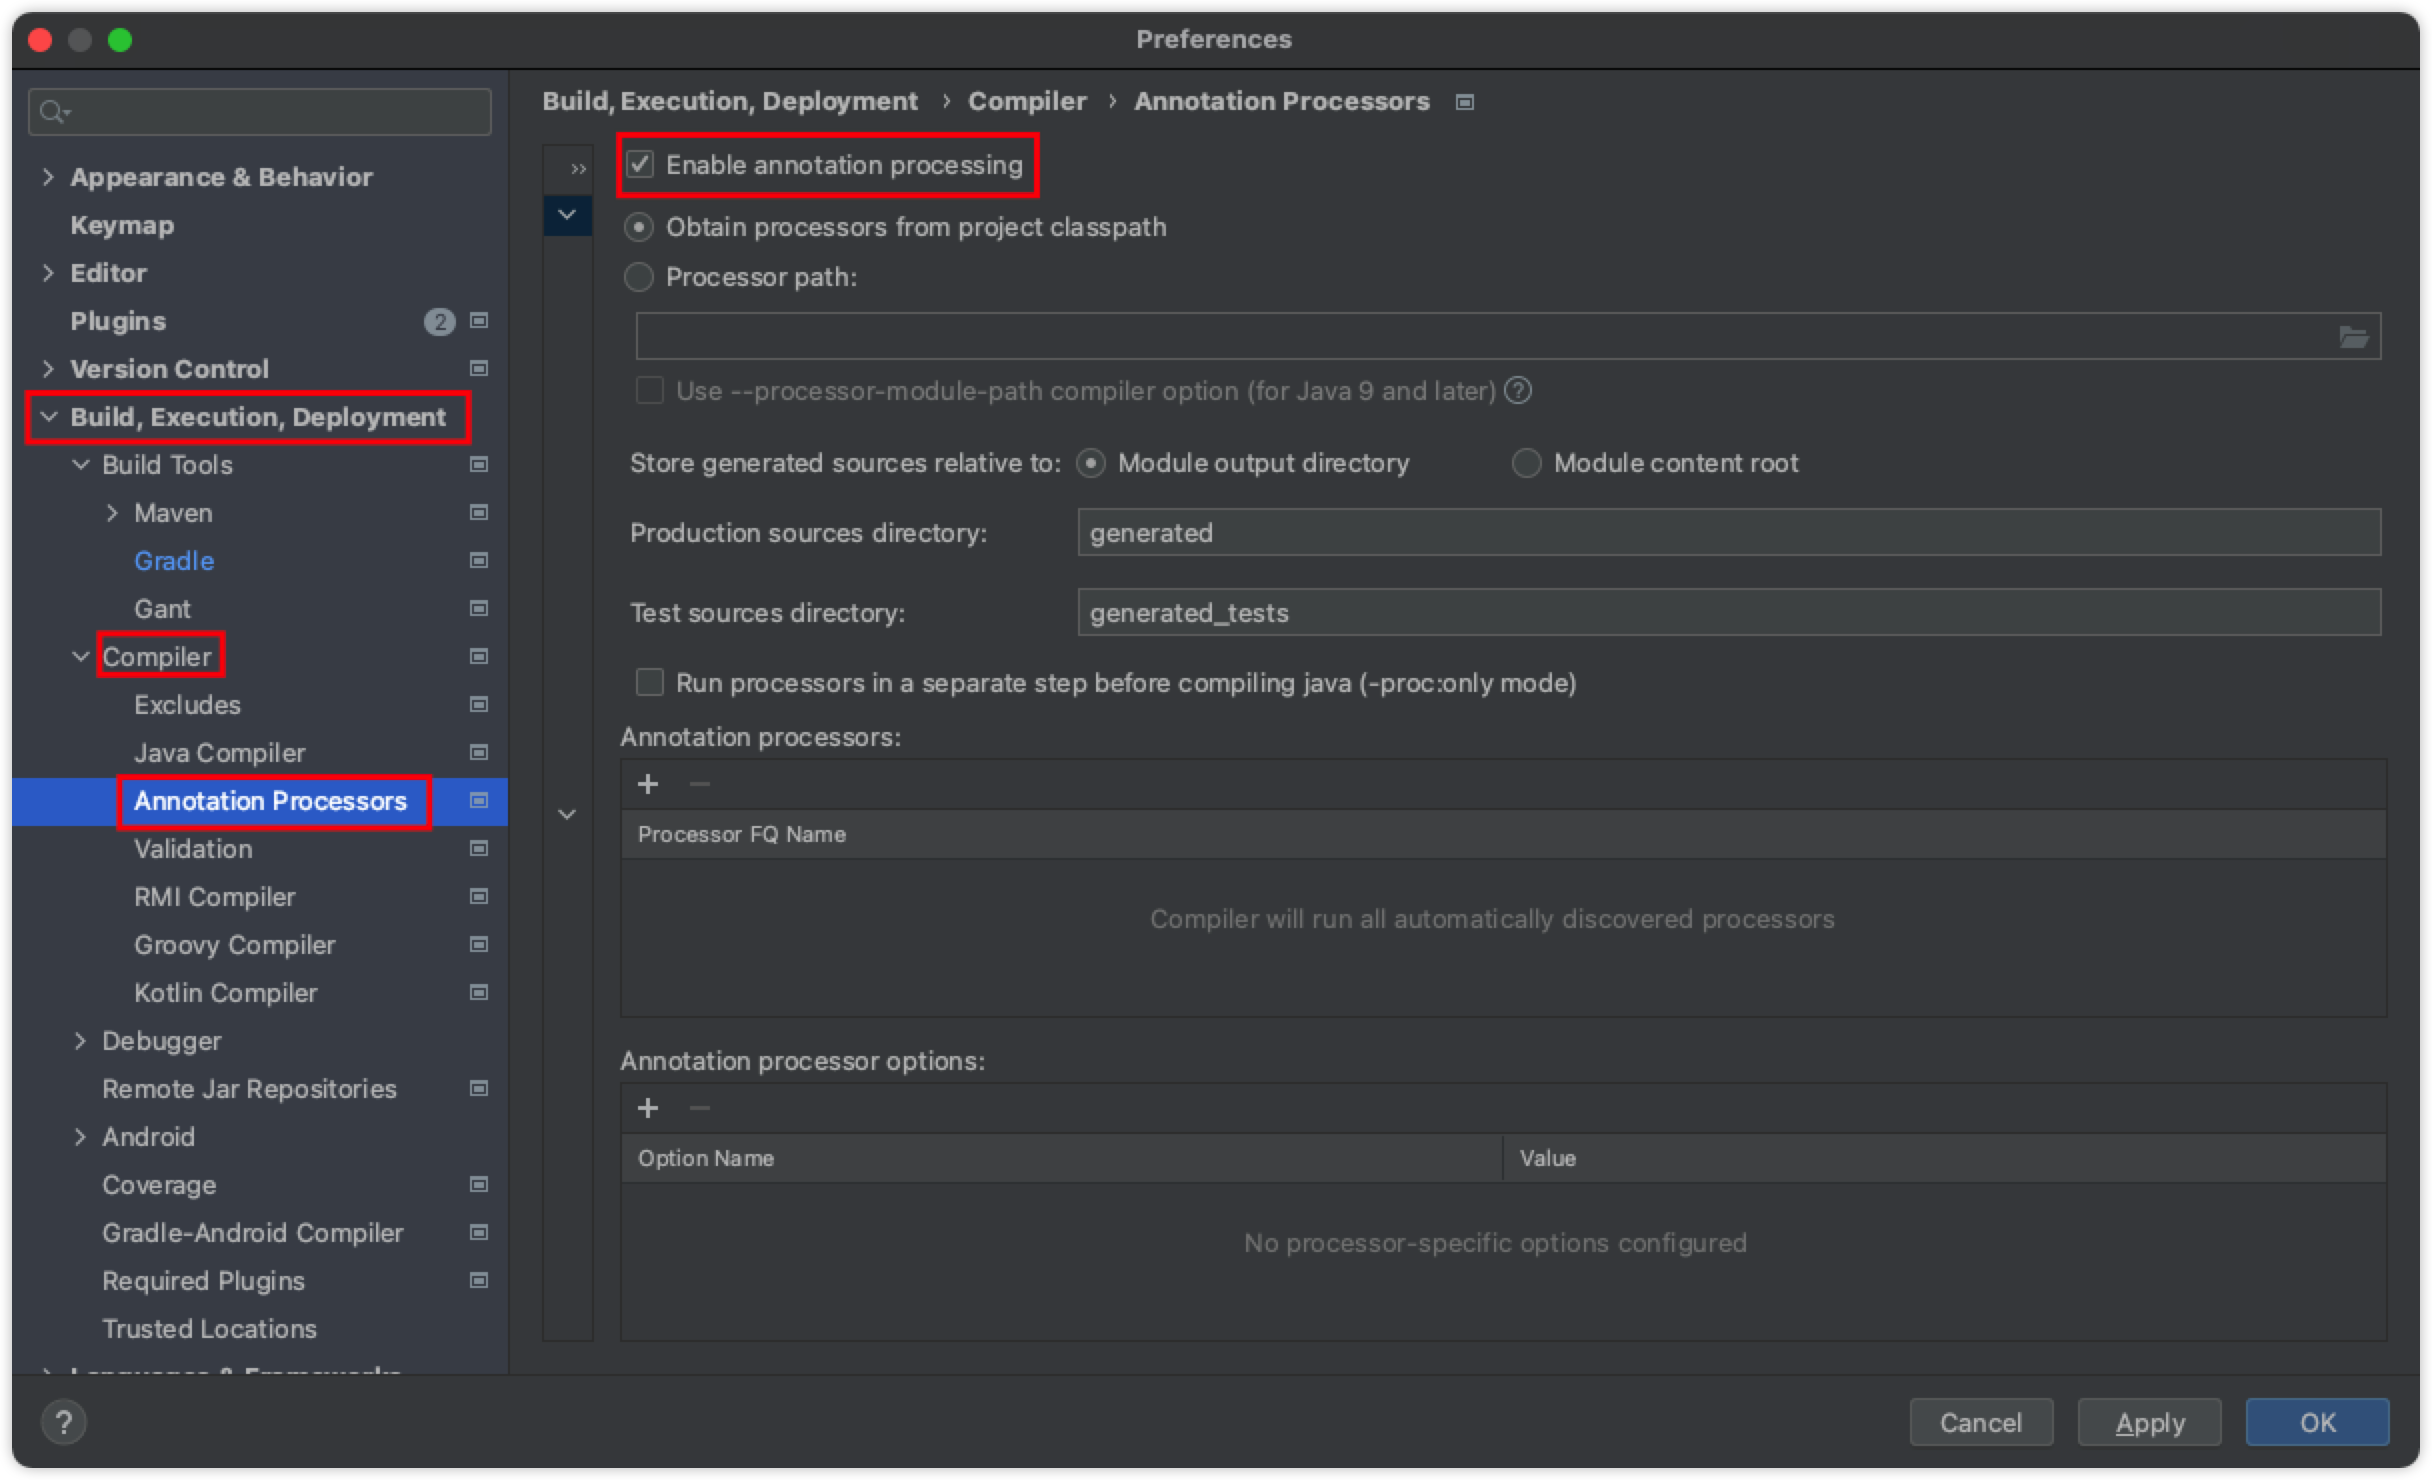
Step 2: Enable Annotation Processing
To ensure Lombok's annotations work correctly, you must enable the annotation processor.
- Navigate to
Preferences->Build, Execution, Deployment->Compiler->Annotation Processors. - Select the
Enable annotation processingcheckbox. - Click "Apply" to save the settings.
Step 3: Verify and Unify the JDK Version
To ensure the project compiles and runs correctly, you must set the JDK version to JDK 8 (latest minor version recommended) in two key locations within IntelliJ IDEA.
1. Configure Project SDK
This is the core JDK used for compiling the project's source code and performing syntax analysis.
- Navigate to
File->Project Structure->, and select "Project" from the left panel. - In the
Project SDKdropdown menu, confirm that version1.8is selected.
2. Configure Gradle JVM
This is the JDK used to execute Gradle build tasks (e.g., build, clean).
- Navigate to
Preferences->Build, Execution, Deployment->Build Tools->Gradle. - In the Gradle JVM dropdown menu on the right, ensure that the selected version is also
1.8, consistent with the Project SDK.
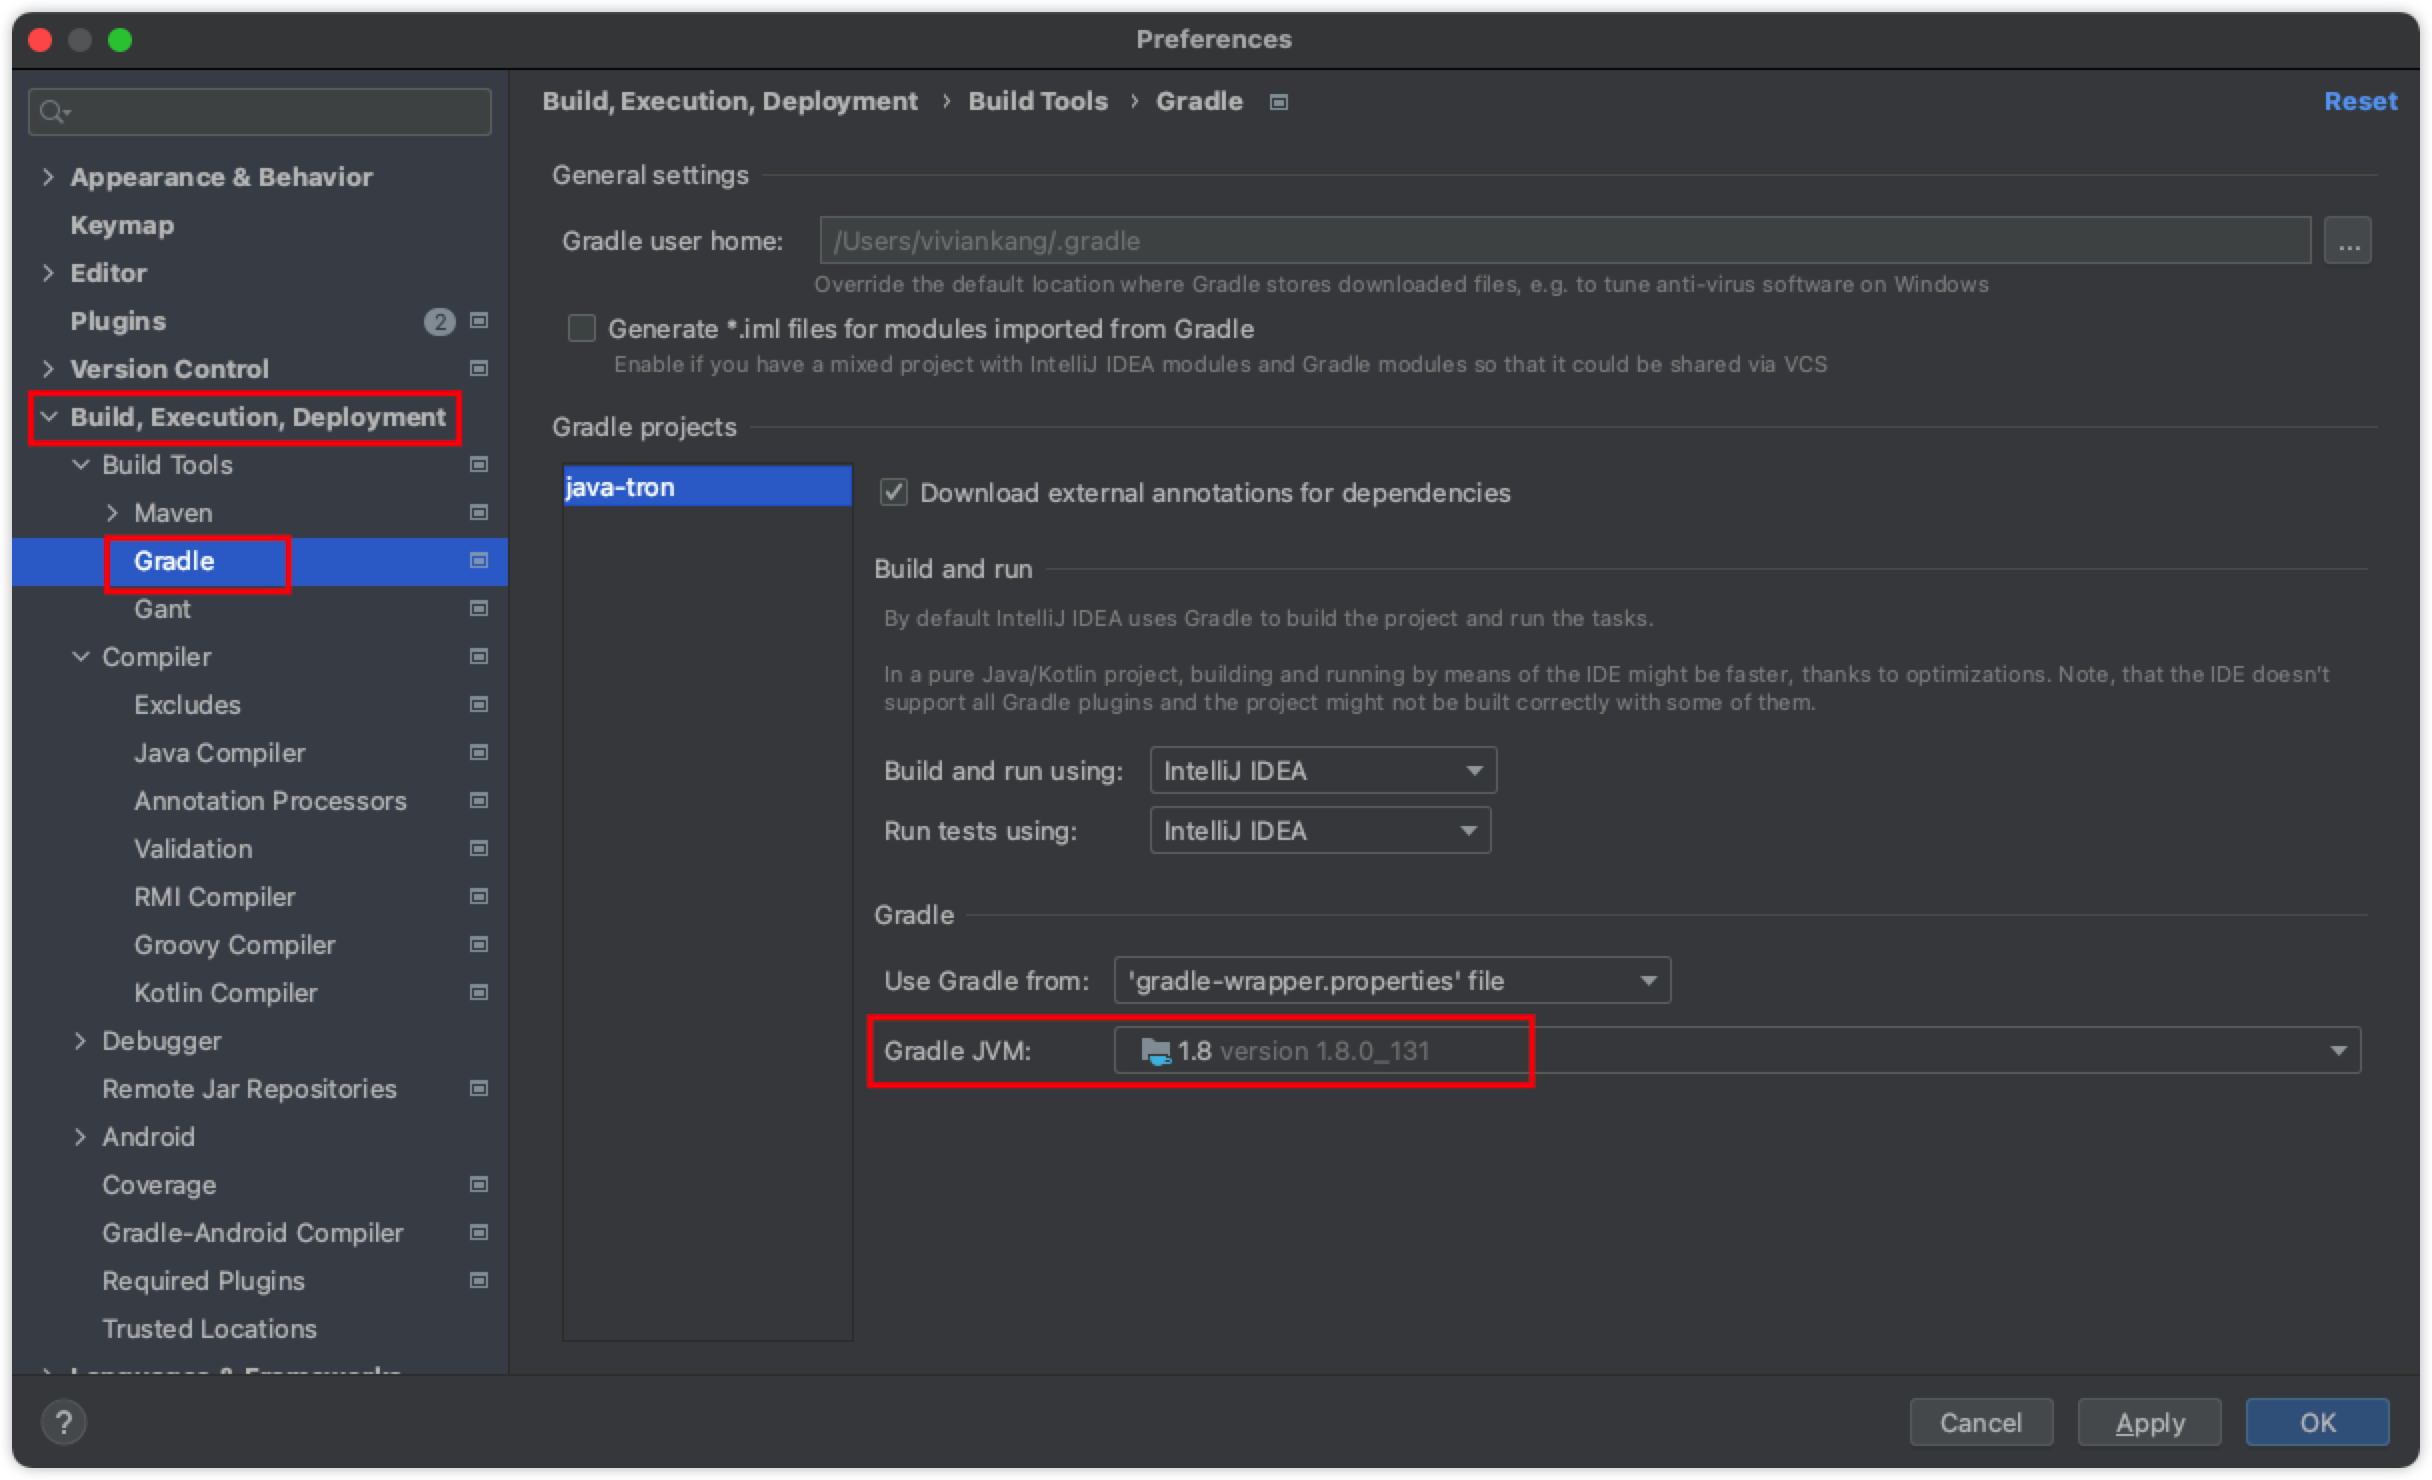
Important Note: The Project SDK and Gradle JVM settings must match and both be set to JDK 8 (latest minor version recommended; consistent with version 1.8 shown in the figure, the difference between 1.8 and 8 is only in the naming convention. In the java-tron documentation, it is uniformly designated as 8 unless otherwise specified). Otherwise, you may encounter unexpected errors during the build process.
Getting and Compiling the Source Code
Step 1: Clone the Source Code
Clone the java-tron source code to your local machine and switch to the develop branch.
git clone https://github.com/tronprotocol/java-tron.git
cd java-tron
git checkout -t origin/develop
Step 2: Compile java-tron
You can compile the project in two ways:
-
Compile using the terminal:
In the root directory of the
java-tronproject, execute the following Gradle command:To speed up the compilation process by skipping unit tests, you can use the# Perform a full build, including all test cases ./gradlew clean build-x testargument:* Compile using the IntelliJ IDEA UI:# Compile while skipping tests ./gradlew clean build -x testOpen the
java-tronproject in IntelliJ IDEA, then clickBuild->Build Projectin the top menu bar to compile the entire project.
Configuring Code Style Checks
java-tron adheres to the Google checkstyle code standard. By configuring the Checkstyle plugin in IDEA, you can check your code style in real-time to ensure the quality of your commits.
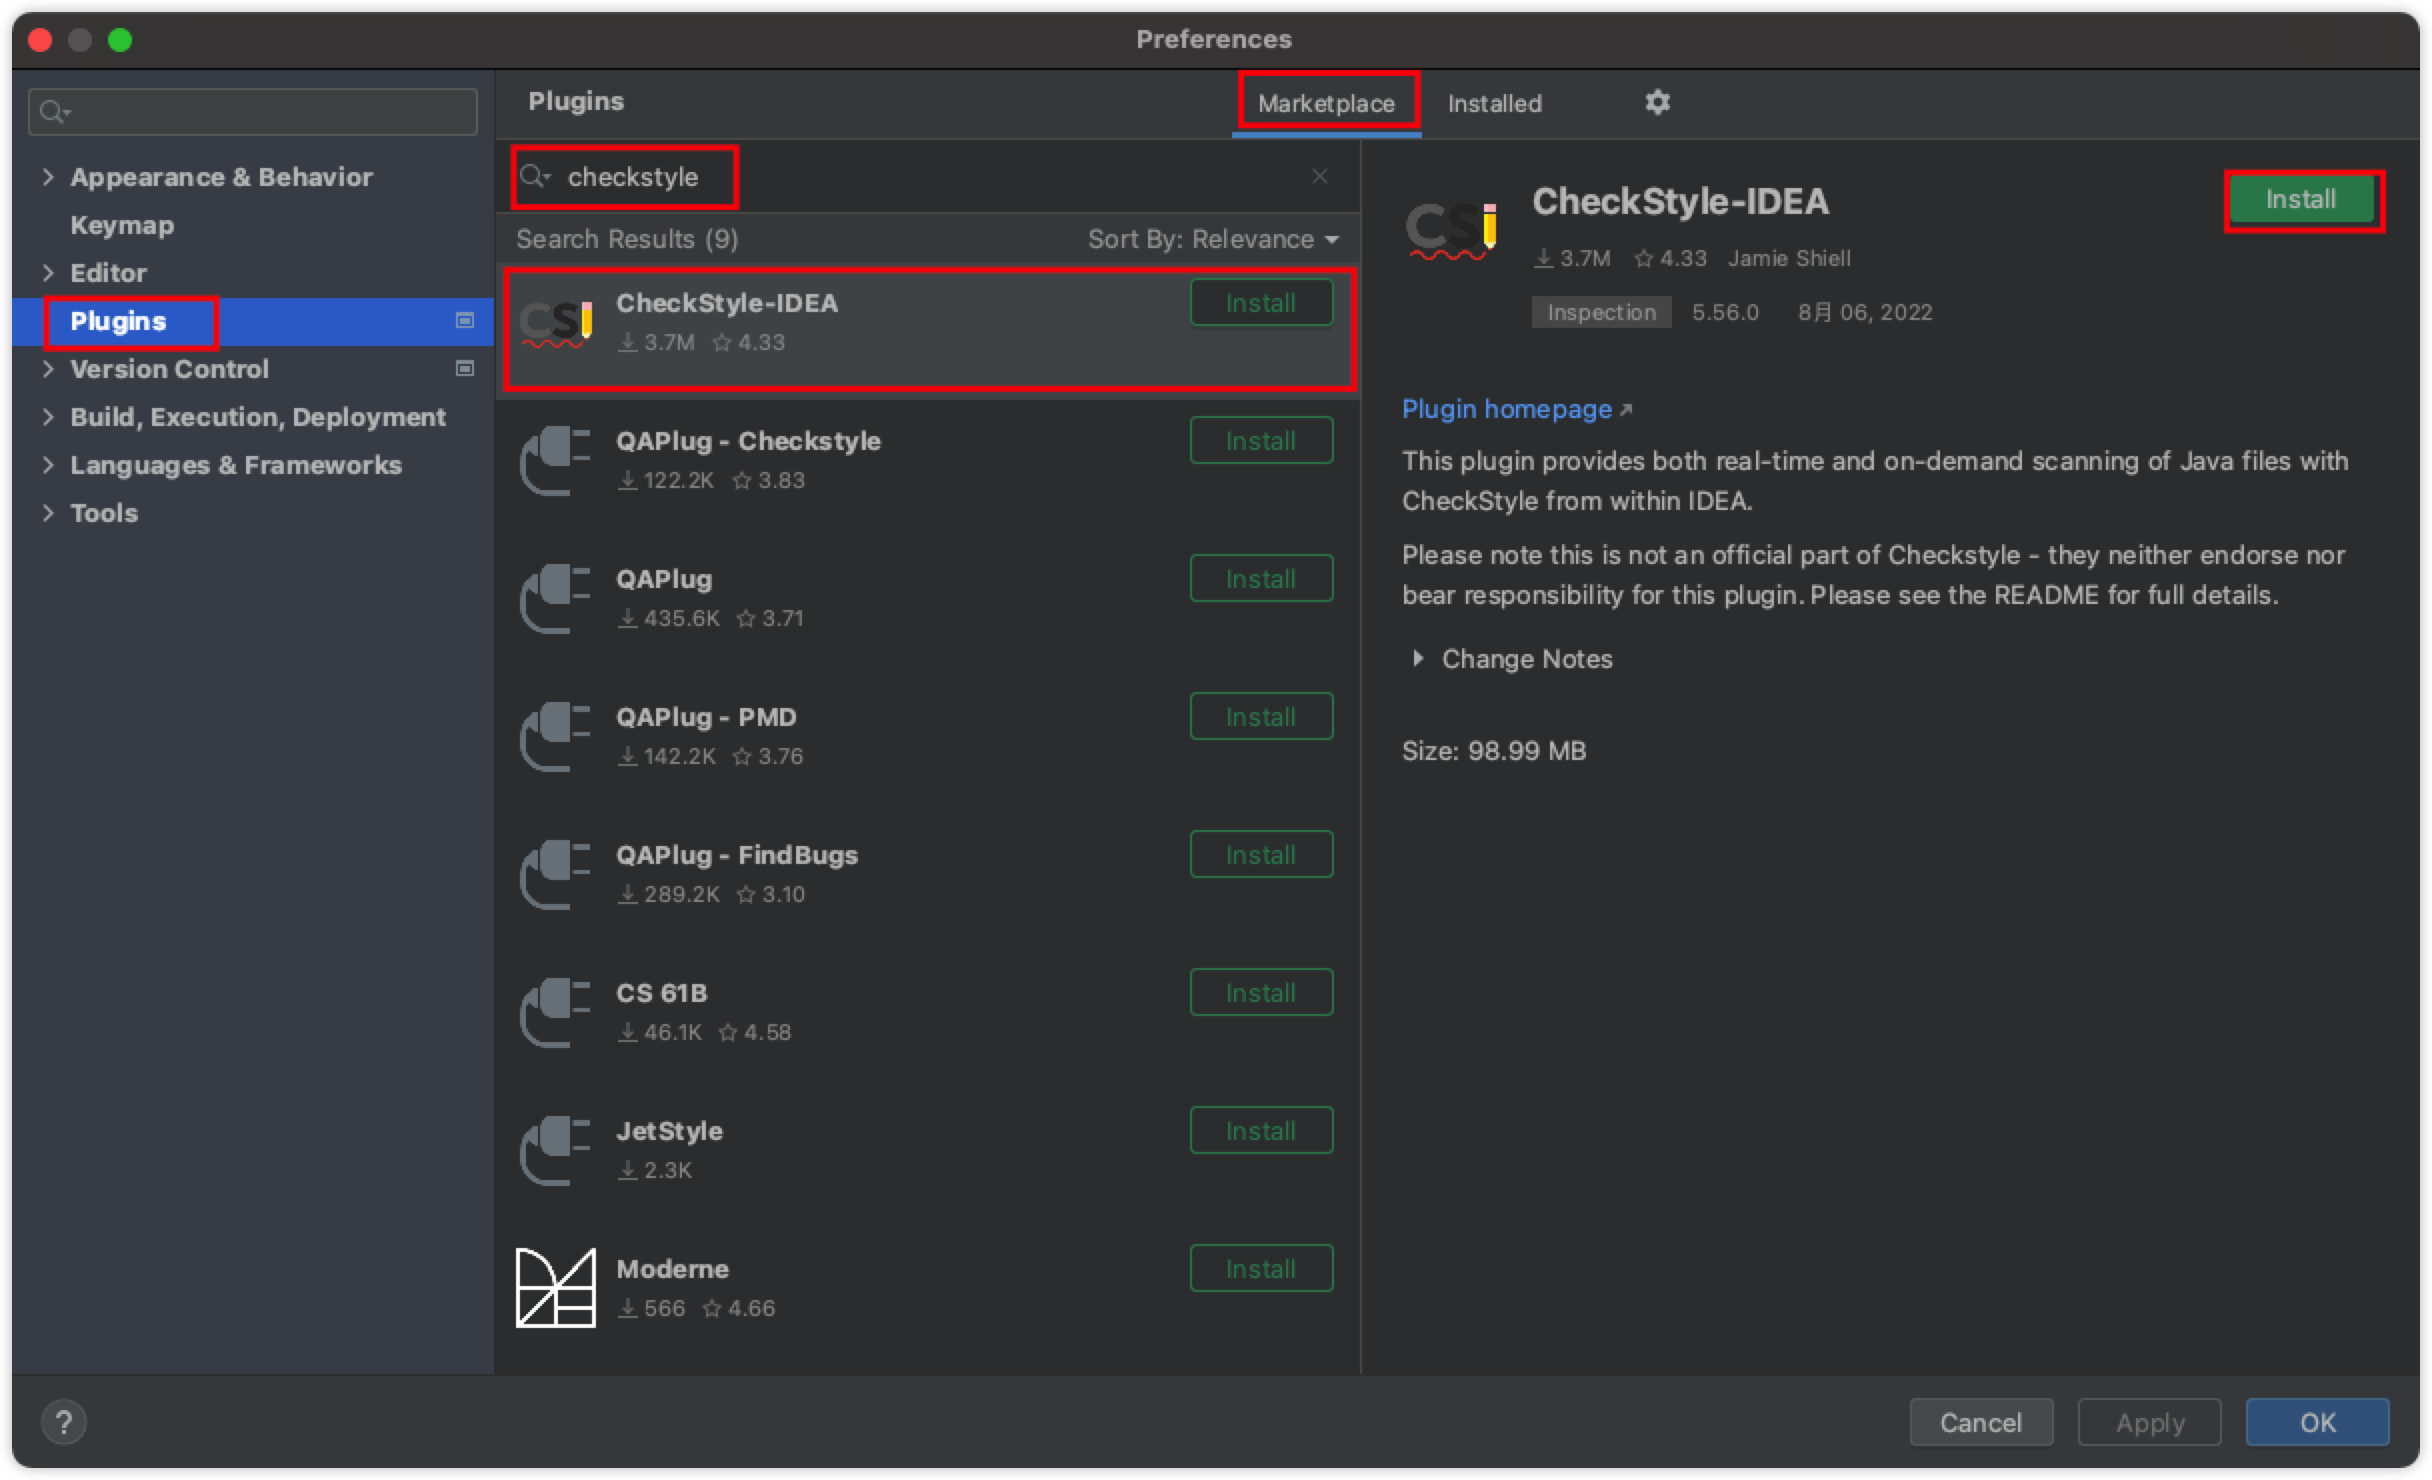
Step 1: Install the Checkstyle Plugin
- In IDEA, navigate to
Preferences->Plugins。 - In the Marketplace, search for and install the
Checkstyleplugin.
Step 2: Configure Checkstyle Rules
- First, locate the code style configuration file. You can use the local
config/checkstyle/checkStyleAll.xmlfile within the project, or download it from the official GitHub Repository. - In IDEA, navigate to
Preferences->Tools->Checkstyleto open the configuration panel. - In the
Configuration Filepanel, click the+icon to add a new configuration.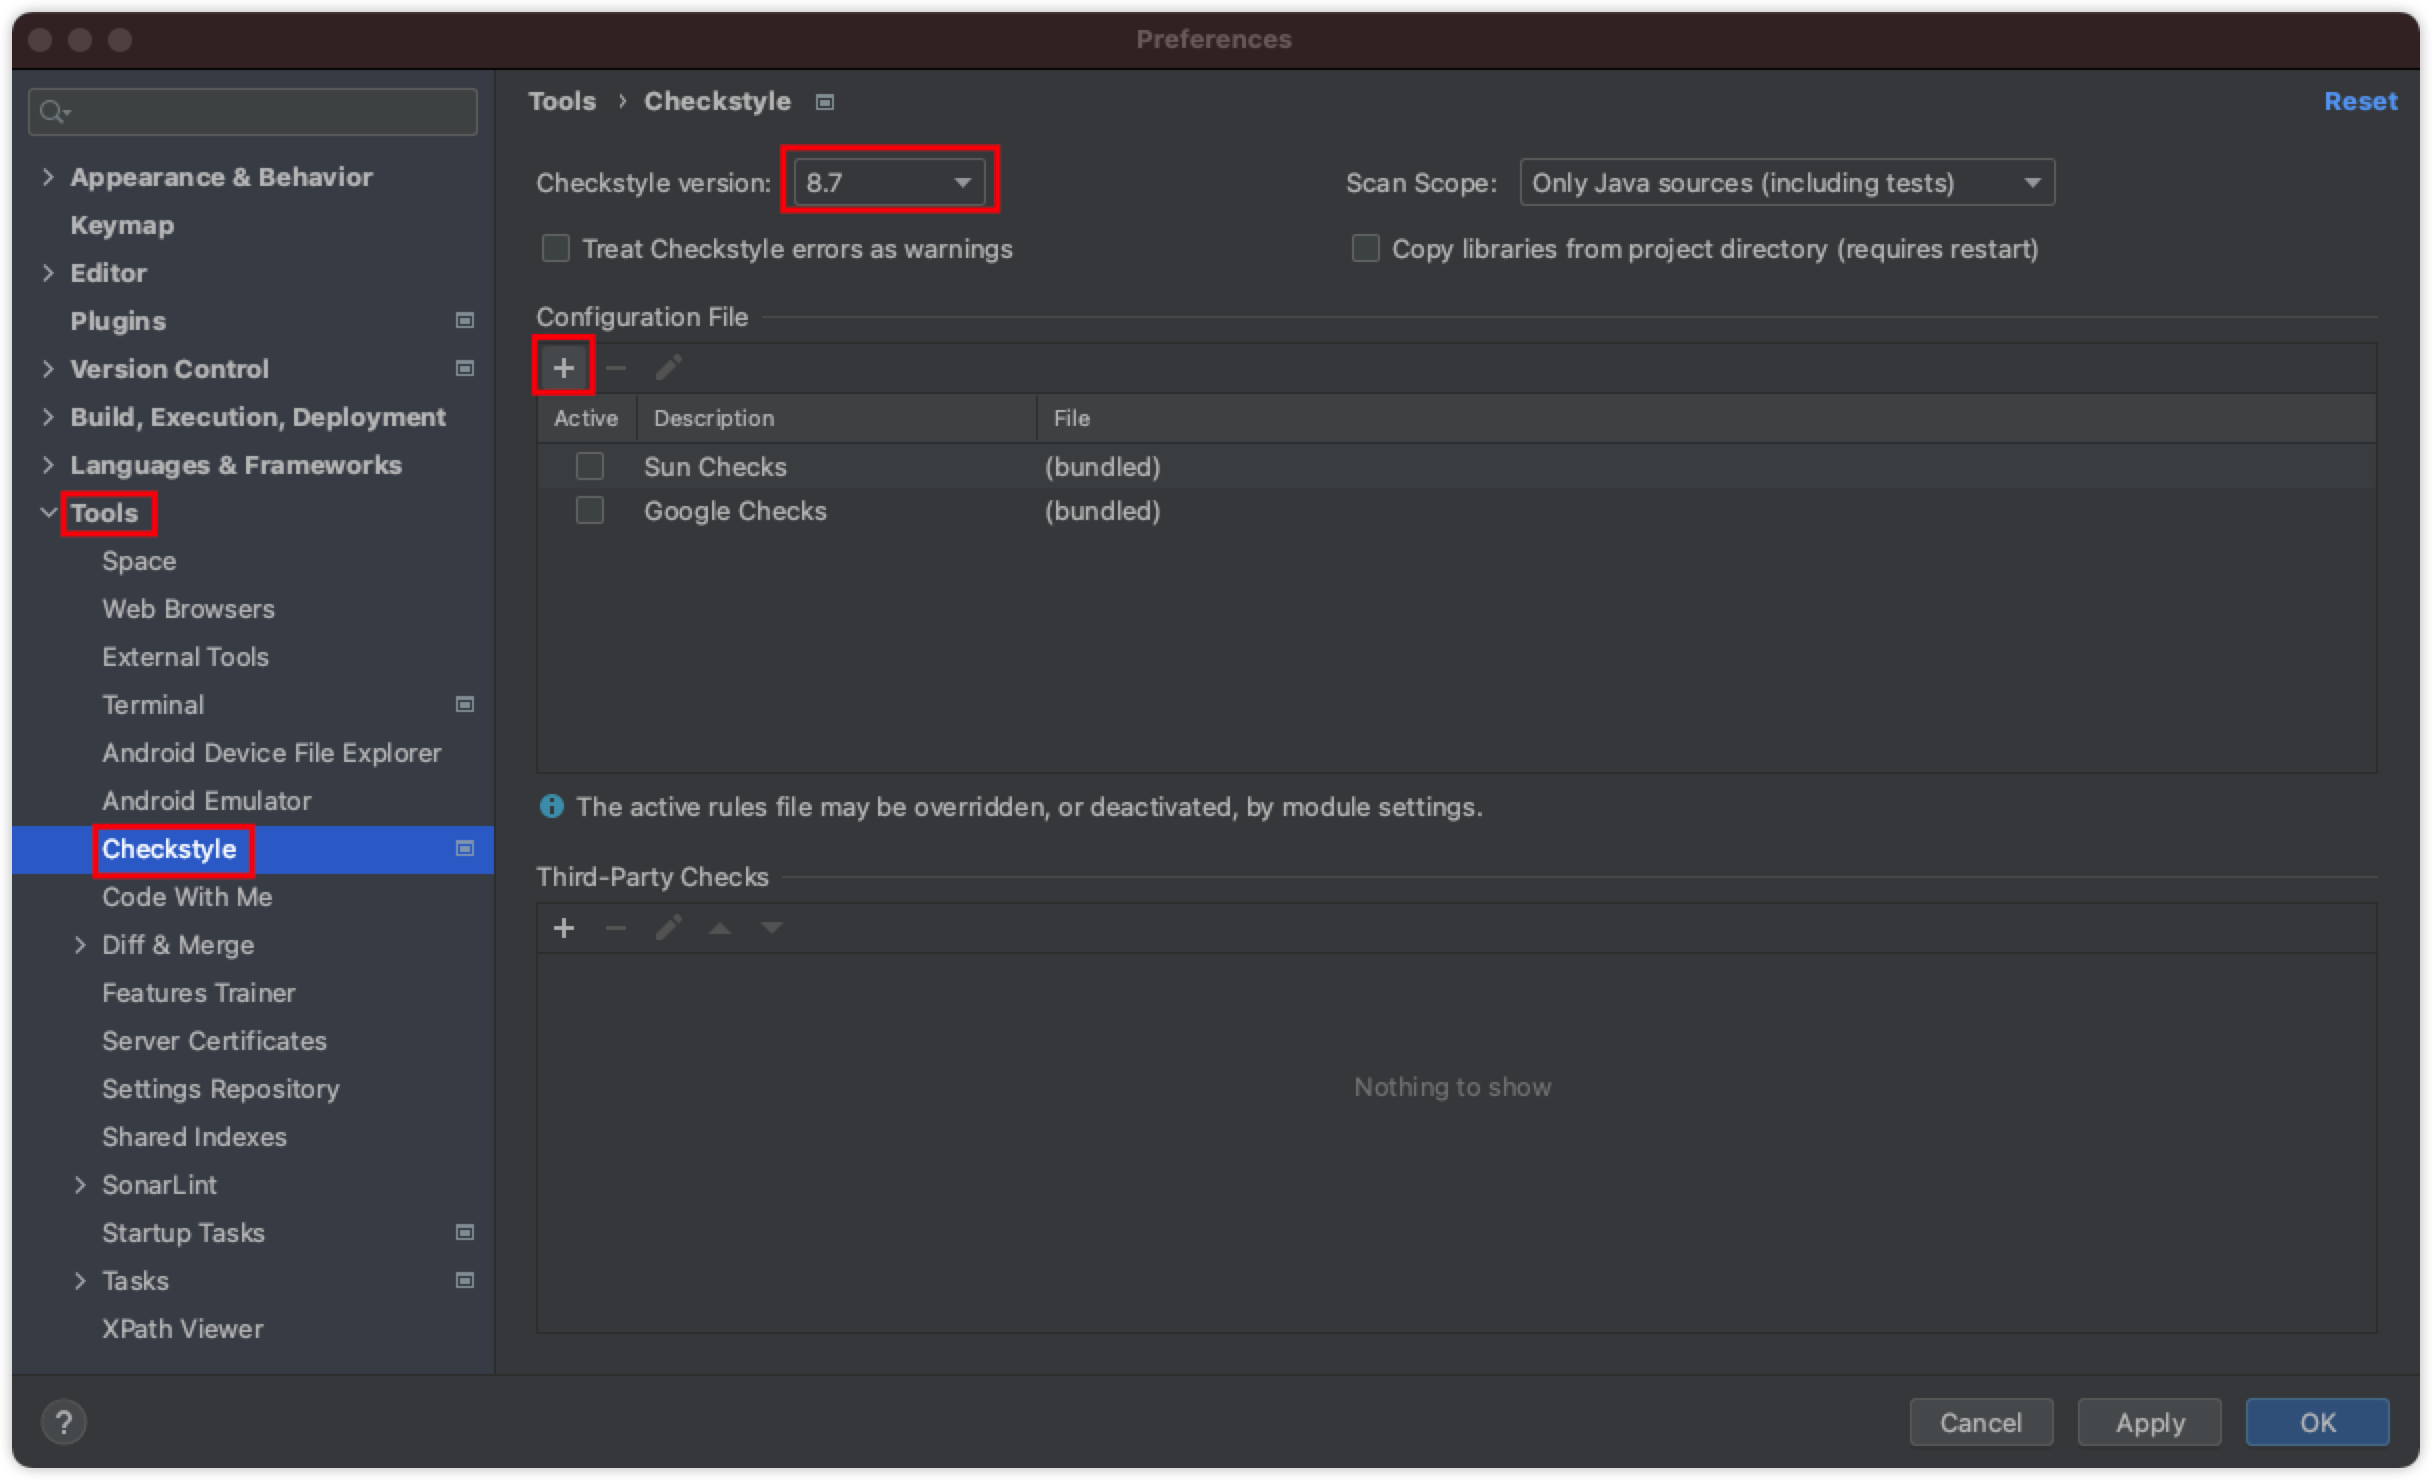
- In the dialog that appears, set the
Descriptiontotron-checkstyleand select thecheckStyleAll.xmlfile you just obtained. - Select the checkbox for the newly added
tron-checkstylerule and click "Apply" and "OK".
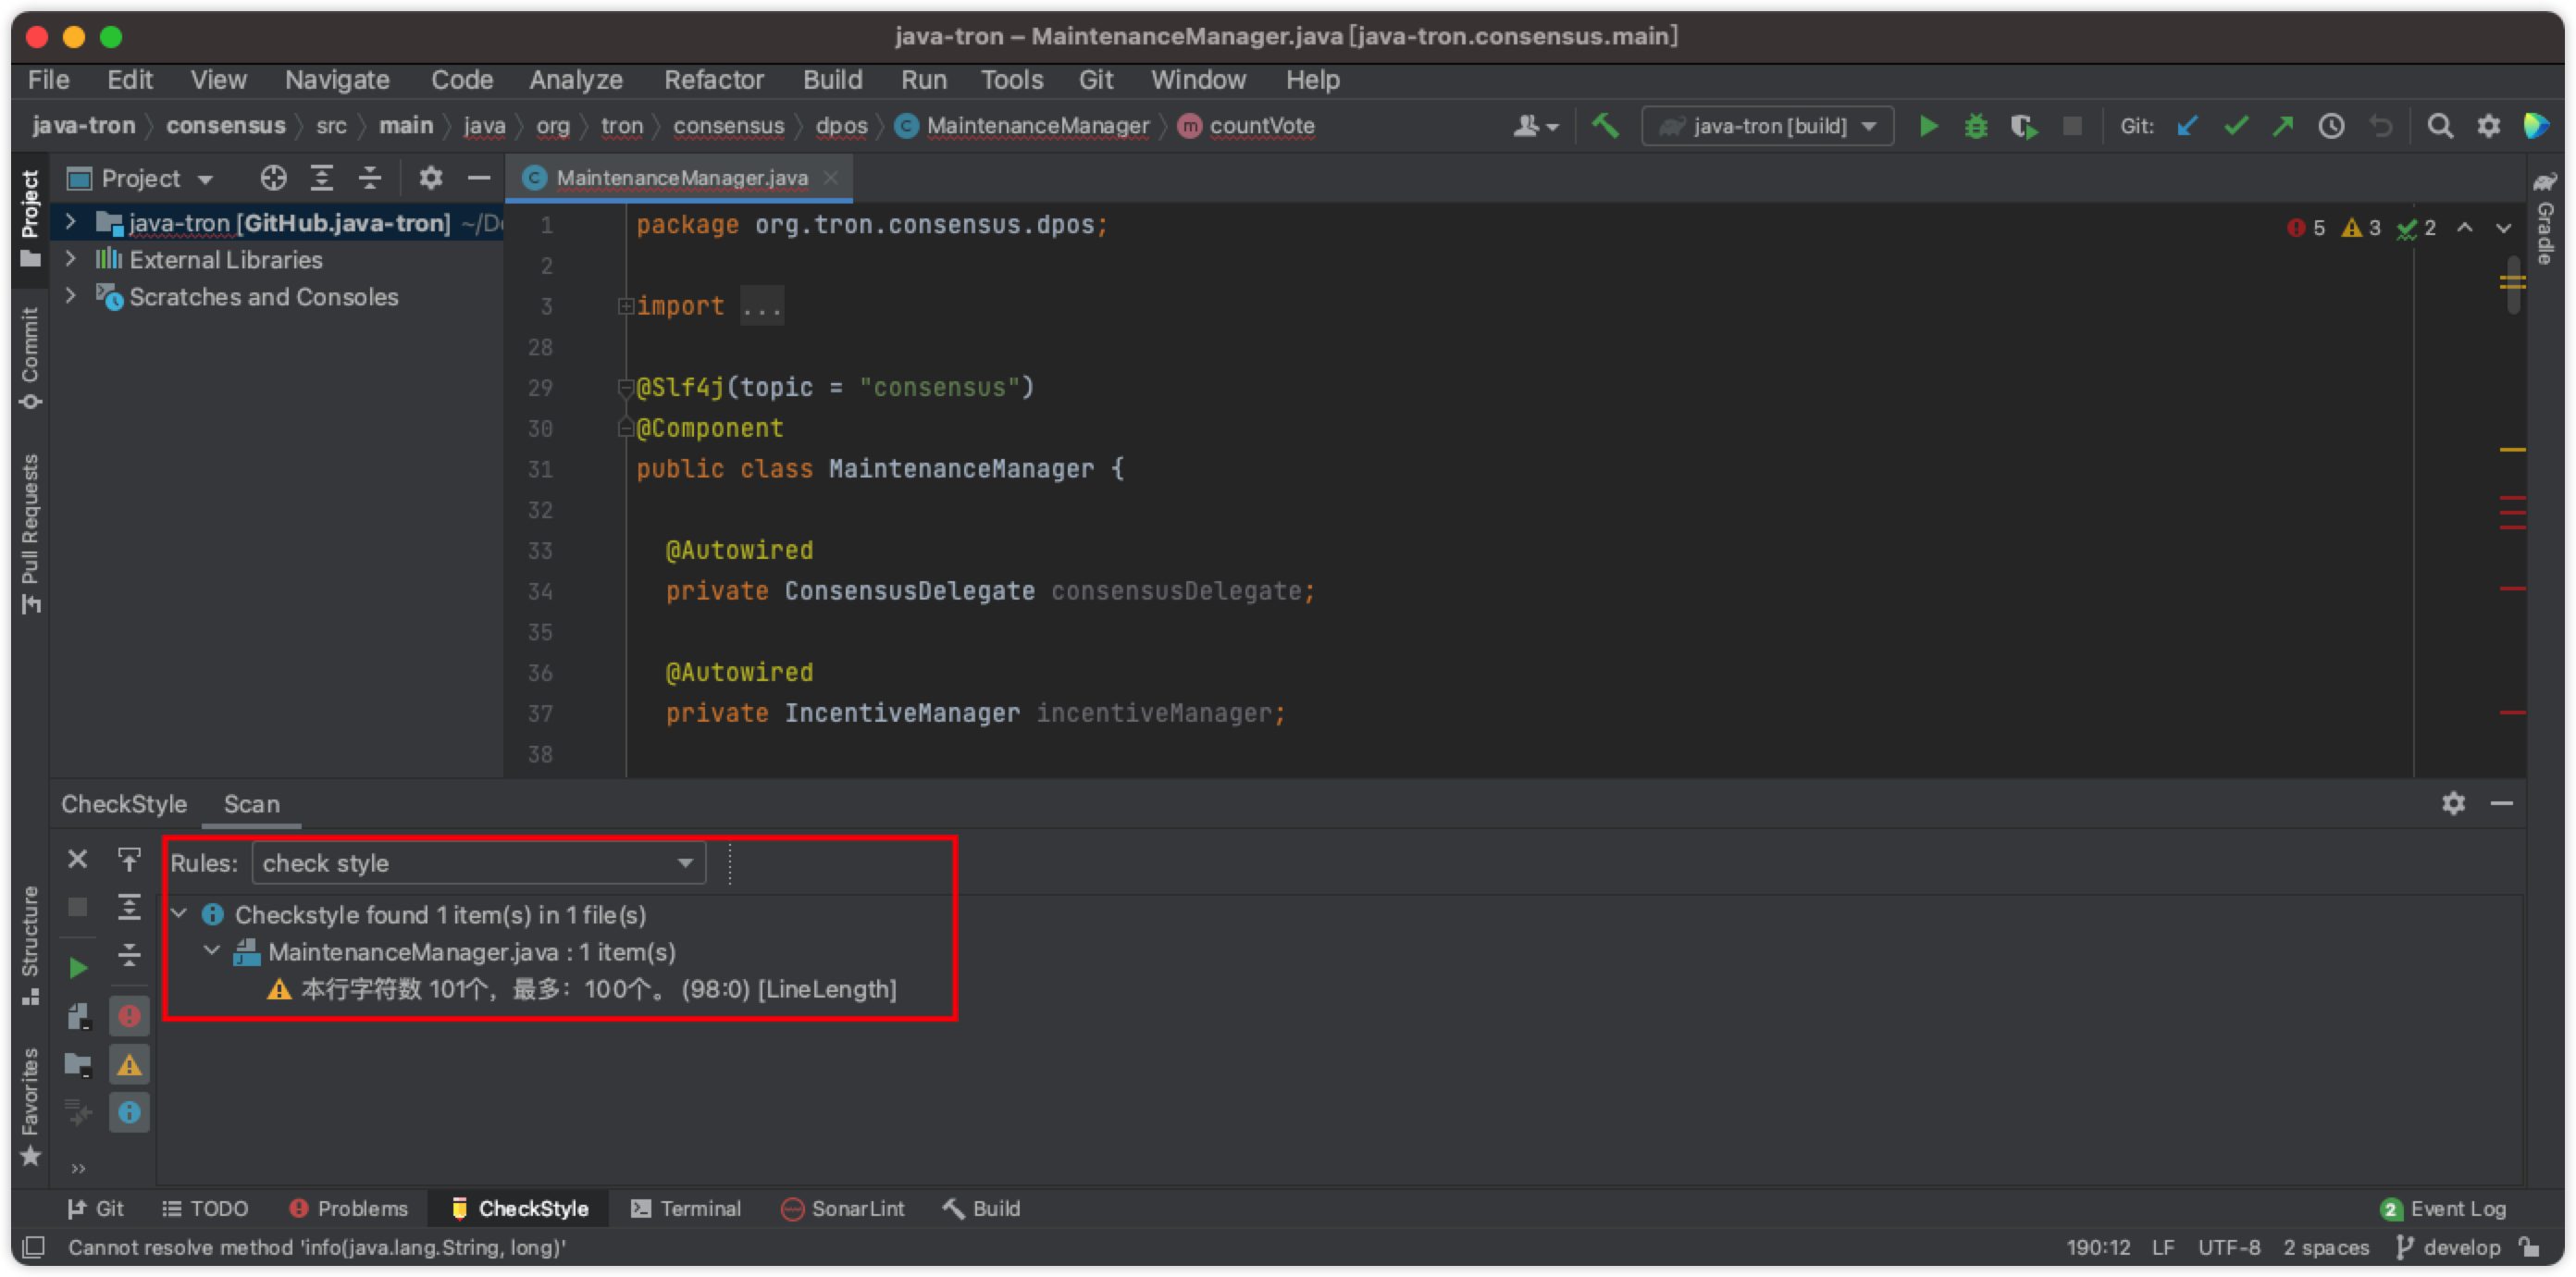
Once configured, you can use the Checkstyle plugin to check your code style. It supports various scopes, allowing you to analyze the entire project, a single module, or the file you are currently editing. The most common operation is to check the current file:
- Right-click in the code editor.
- Select "Check Current File".
If any code style issues are detected, Checkstyle will list them in a window at the bottom. Before committing your code, correct all reported issues according to the prompts to maintain codebase consistency.
Running and Debugging
Step 1: Create a Working Directory
Before running java-tron, you need to create a working directory to store the database and log files generated by the node at runtime.
mkdir /Users/javatrondeploy
Important Note: java-tron will look for the
config.conffile in this directory. Before starting the node, ensure you have placed the correct configuration file in this directory.
Step 2: Configure Run/Debug Options
Next, create a new run configuration in IntelliJ IDEA to define how it launches the java-tron application.
- In the top-right corner of IDEA, click
Add Configuration.... - Click
+->Applicationto create a new run configuration. - Find and set the following options in order:
- Name: Give the configuration a name, e.g.,
Fullnode. - JDK: Ensure you select
java 8 1.8. - Main Class: Set to
org.tron.program.FullNode. - Program Arguments: Enter the node startup arguments. For example, use
-c config.confto specify the configuration file. - Working Directory: Set this to the directory you created in Step 1, e.g.,
/Users/javatrondeploy。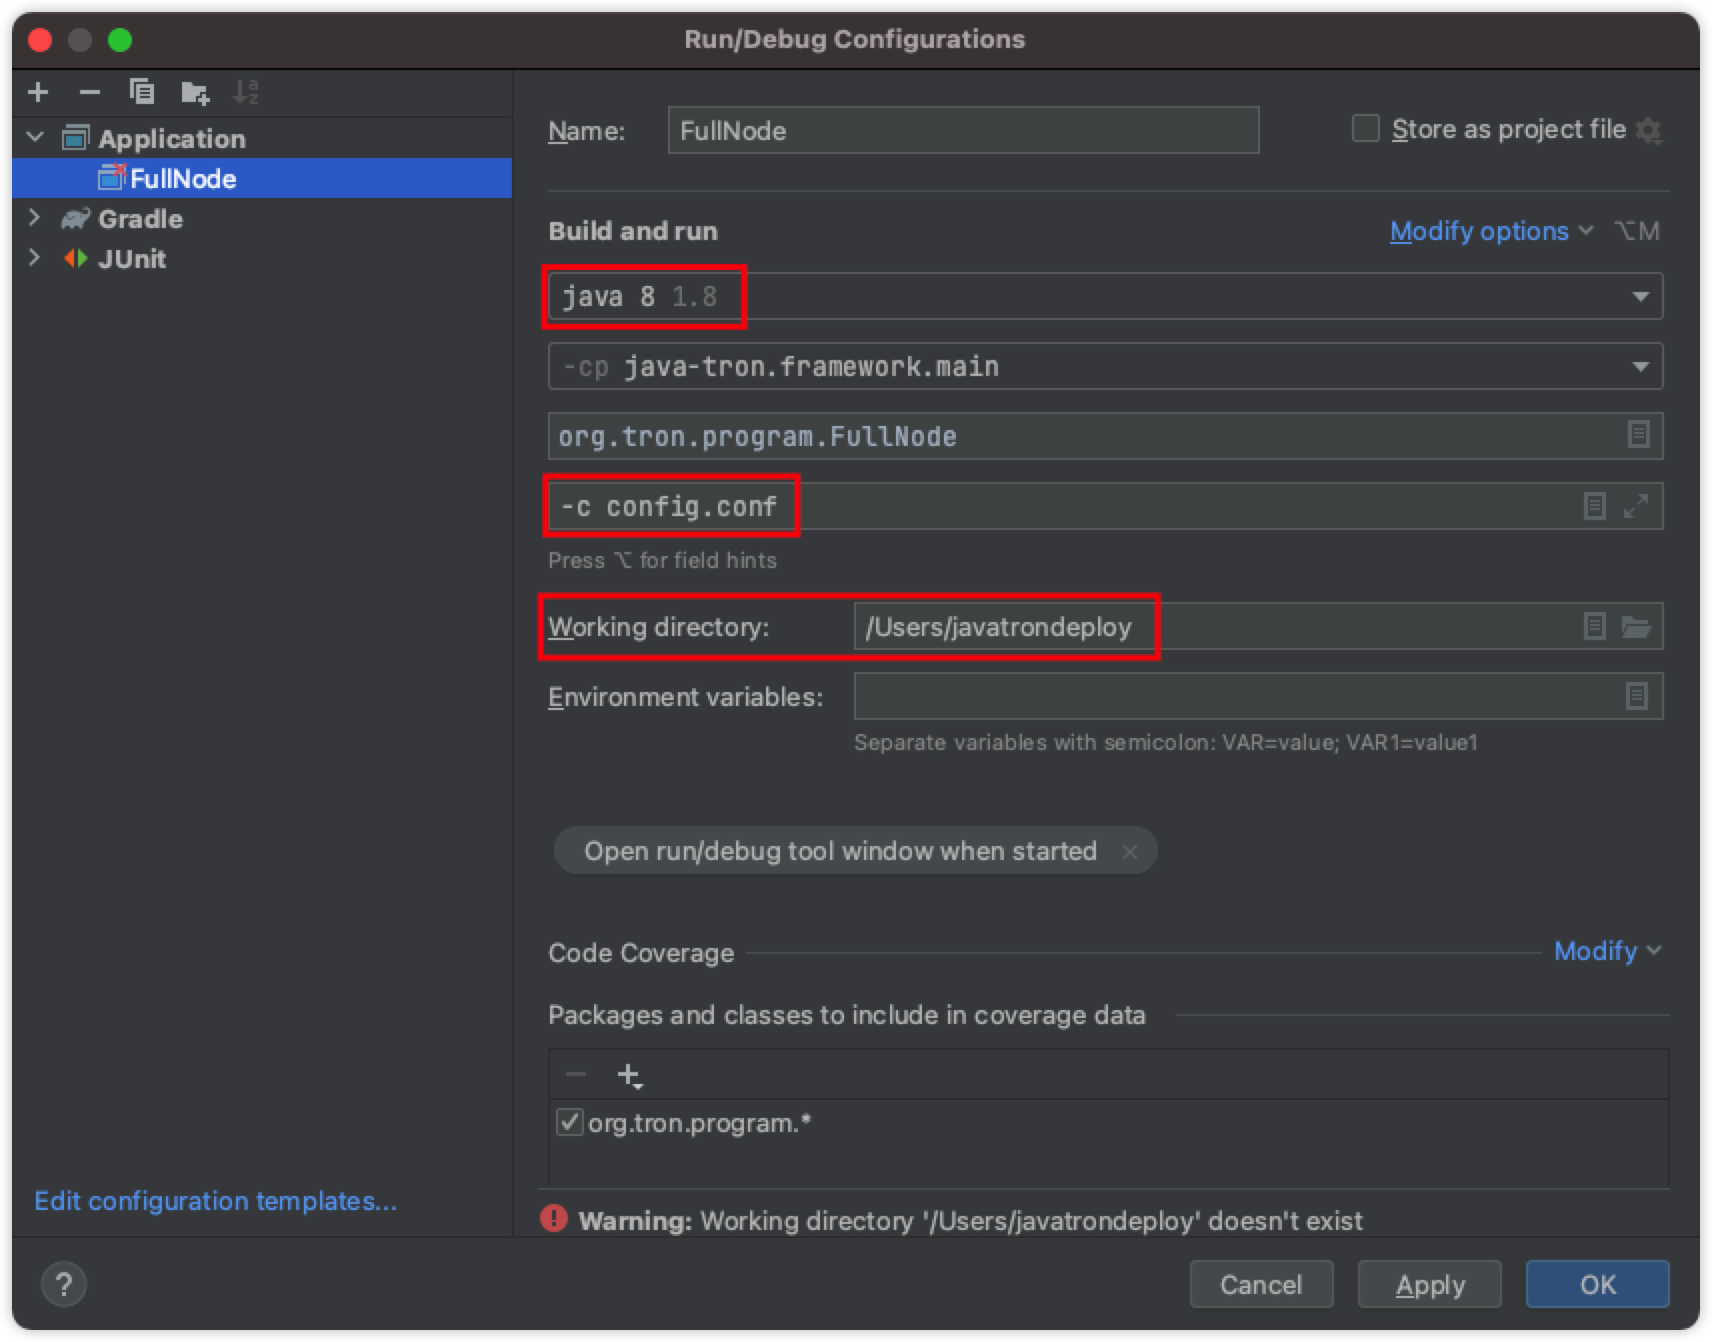
- Name: Give the configuration a name, e.g.,
- Click “Apply” to save the configuration.
Step 3: Start the Node
Now you can start the java-tron node from within IDEA:
- Run the node: Click
Run->Run 'FullNode'in the top menu bar.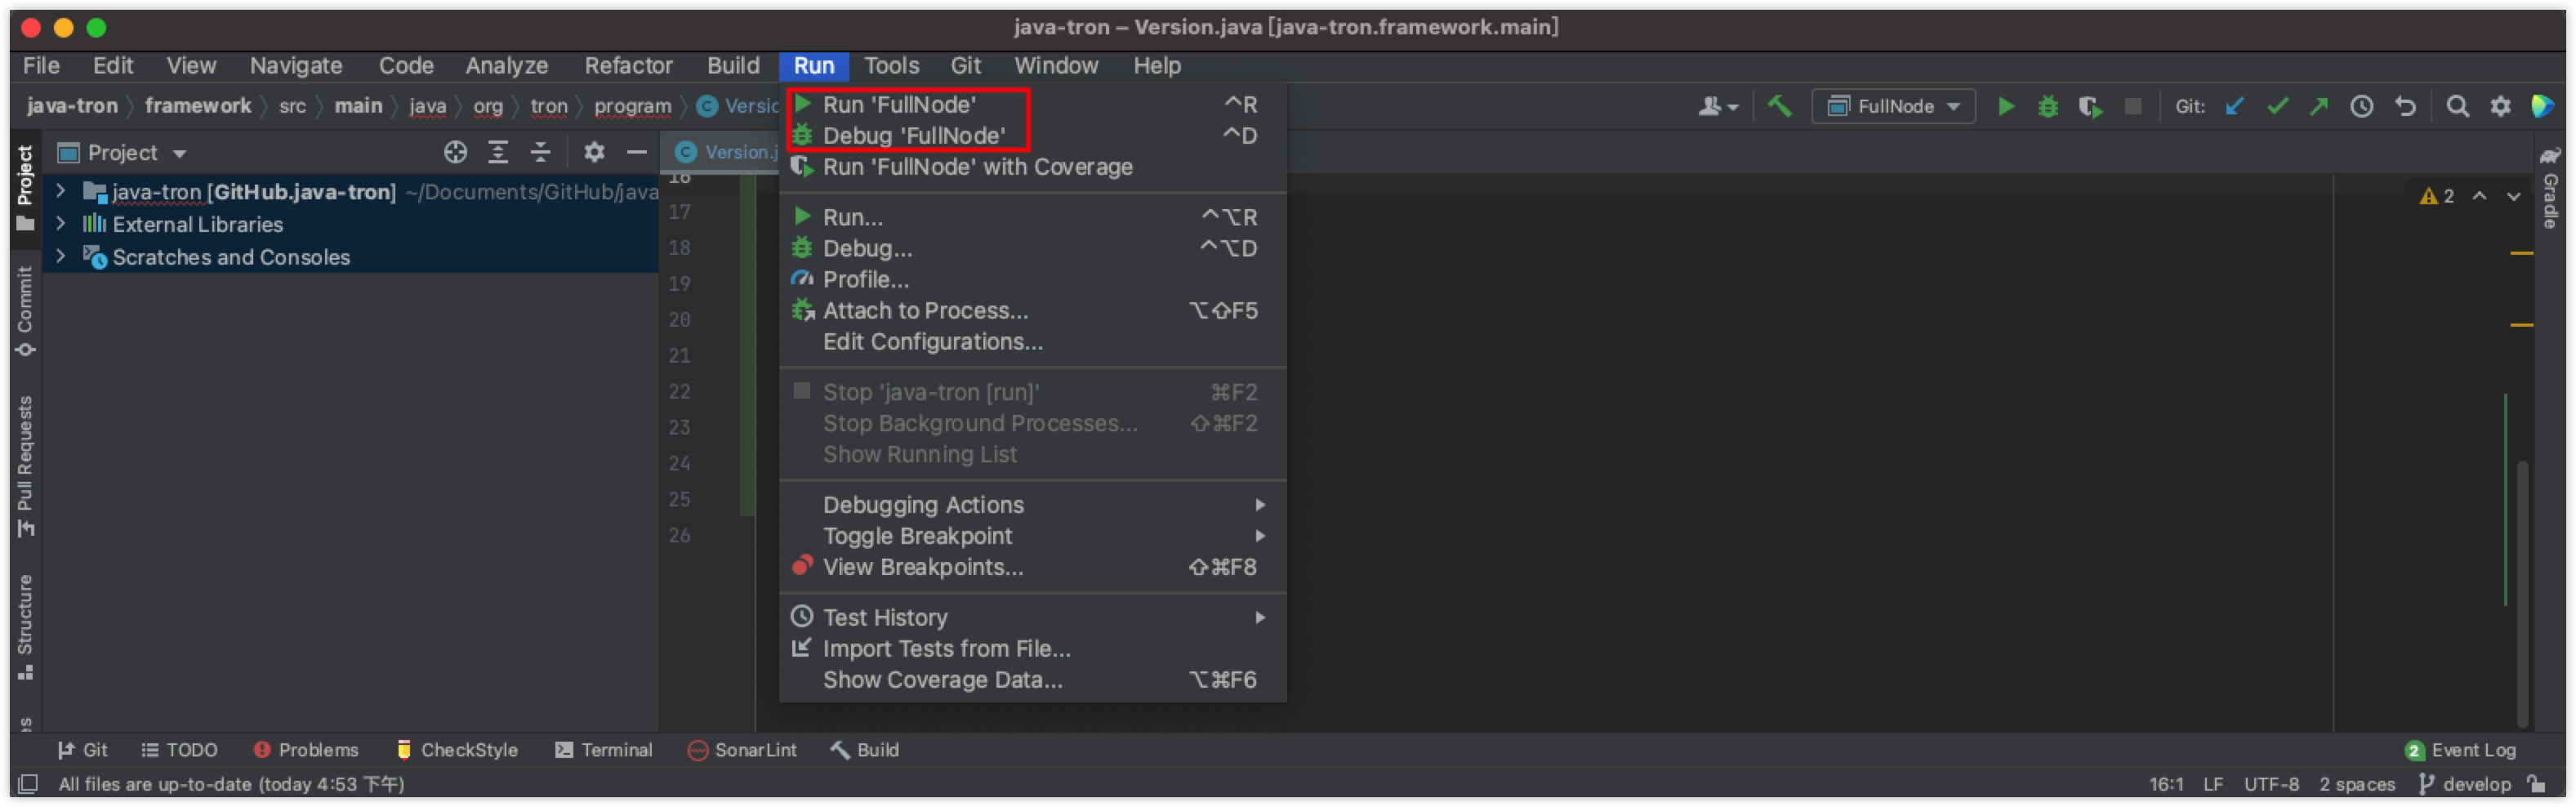
- Debug the node: Set breakpoints in your code, then click
Run->Debug 'FullNode'. The program will pause at the breakpoints, which allows you to perform step-by-step debugging.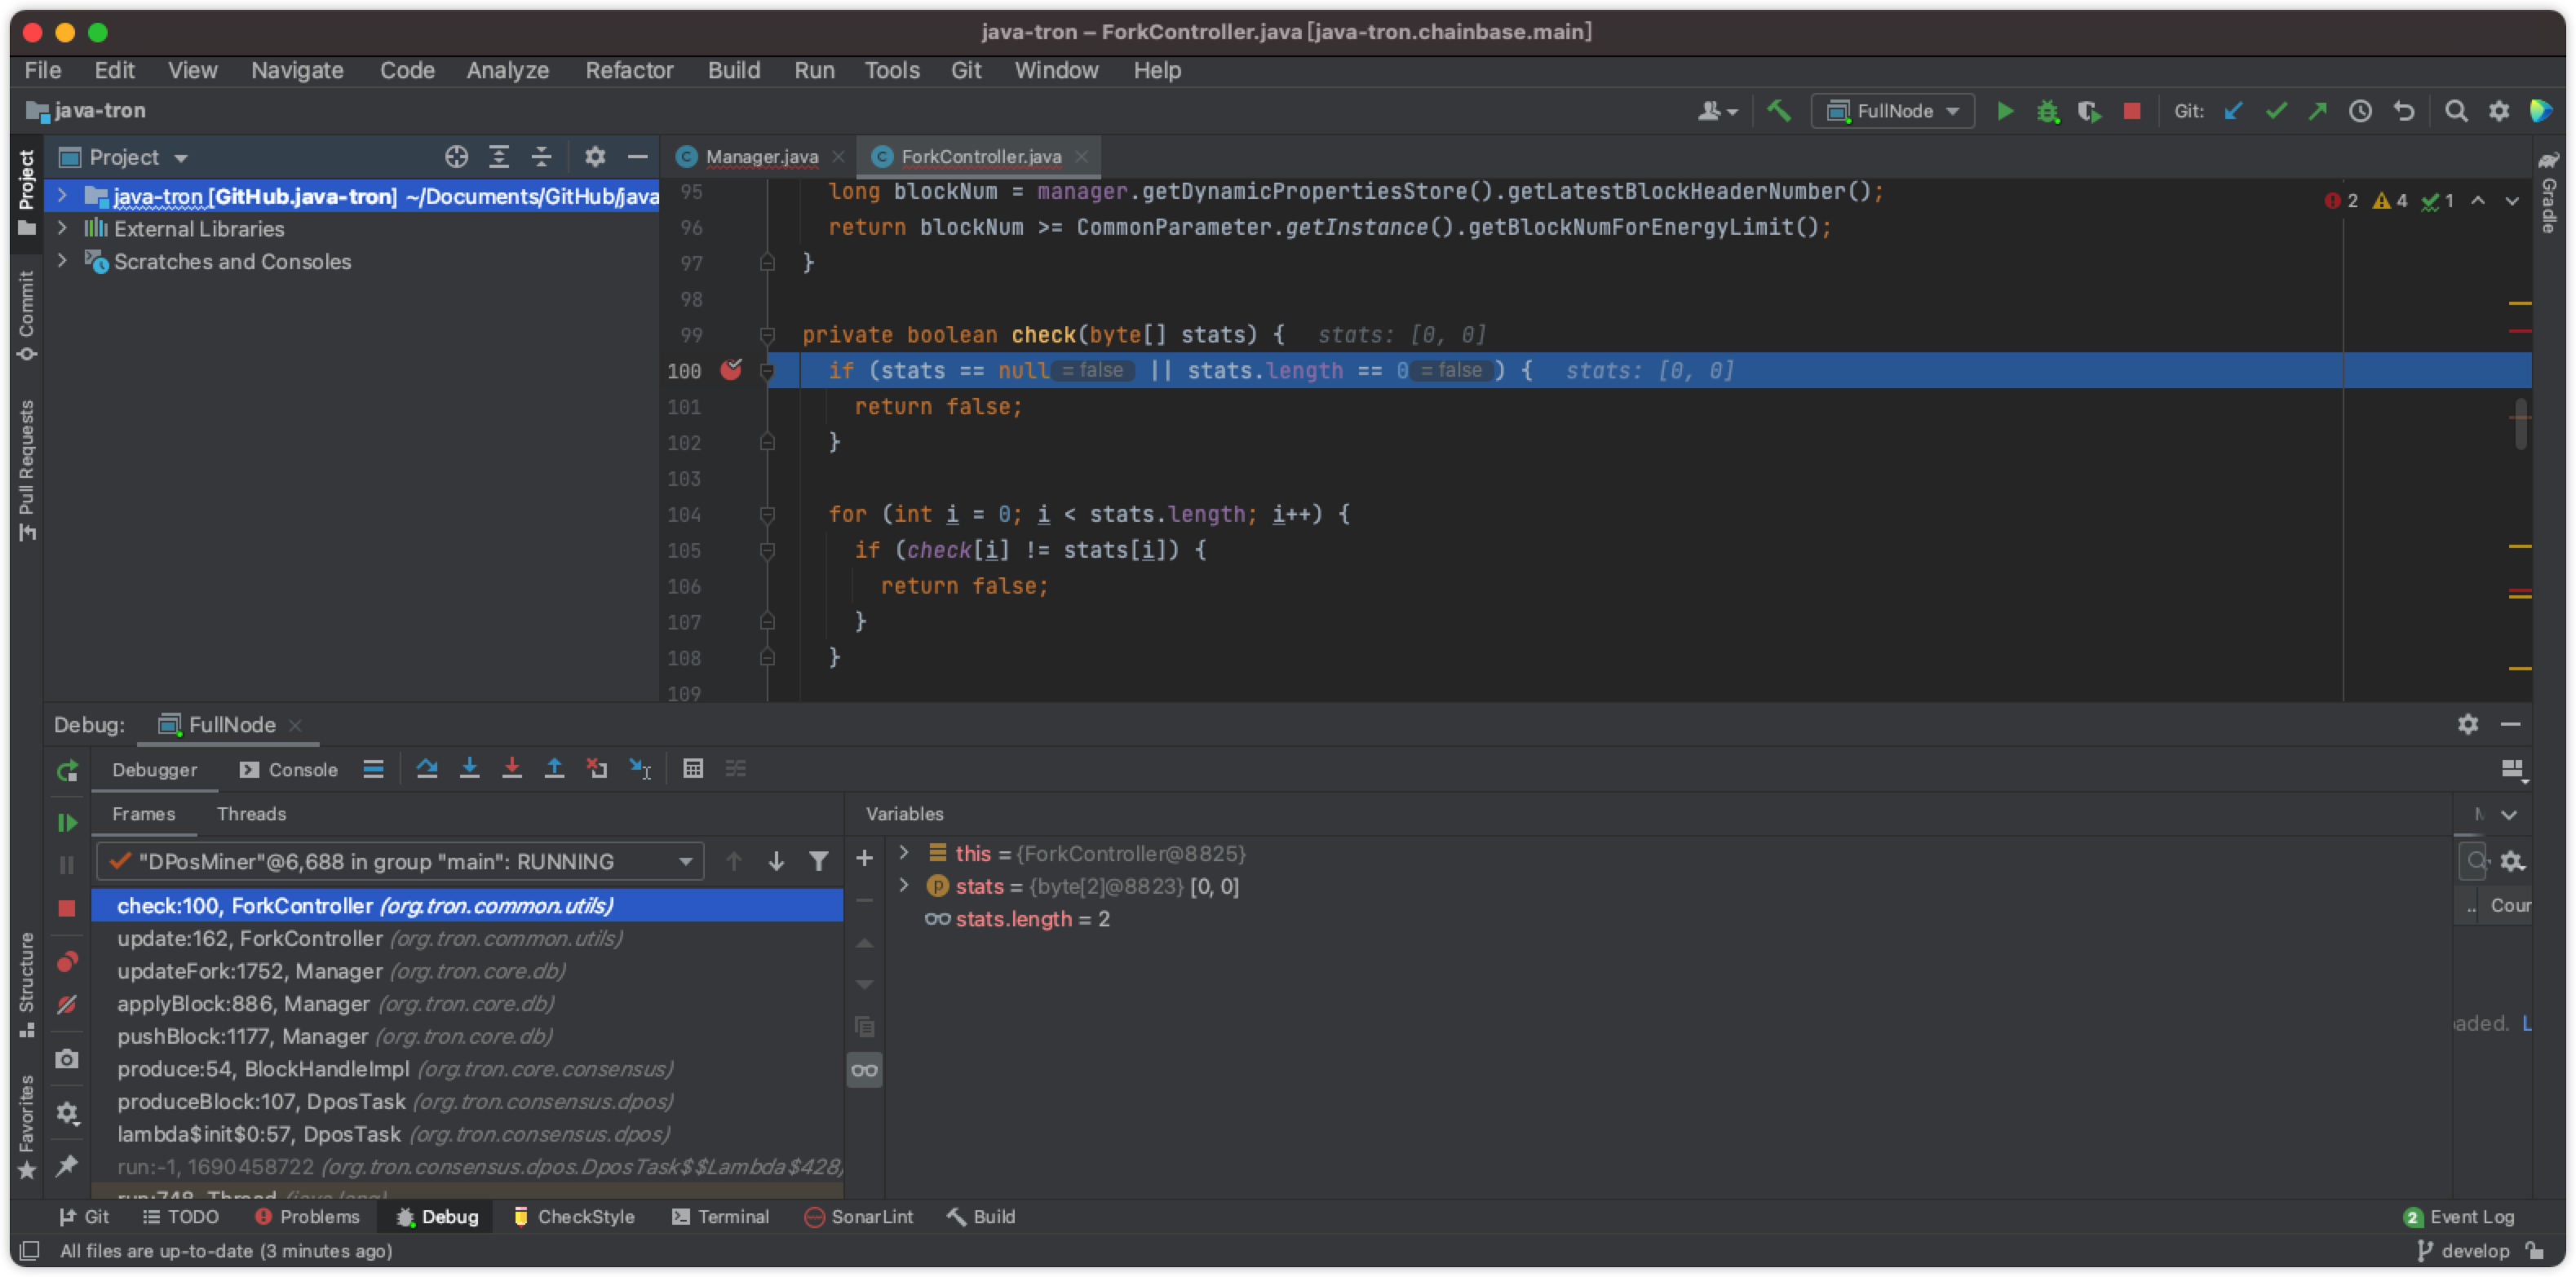
After the node starts, relevant log files will be written to the Working directory you configured.