java-tron Node Metrics Monitoring
Starting from the GreatVoyage-4.5.1 (Tertullian) version, java-tron nodes expose metrics in the Prometheus exposition format on a /metrics endpoint, allowing node operators to monitor node health more conveniently. For the meaning of each exposed metric, see the All Metrics section of the tron-docker metric_monitor README. To monitor various node metrics, you must first deploy a Prometheus service to communicate with the java-tron node and scrape metric data from this endpoint. Then you need to deploy a visualization tool, such as Grafana, to display the node data obtained by Prometheus in the form of a graphical interface. The following will introduce the deployment process of the java-tron node monitoring system in detail.
Configure java-tron
To use Prometheus for monitoring, you must first enable Prometheus metric monitoring and set the HTTP port in your node's configuration file. Locate the node.metrics block in config.conf and set prometheus.enable to true:
node.metrics = {
  prometheus {
    enable = true
    port = 9527
  }
}
Start the java-tron Node
After updating the configuration, start the node as described in Starting a java-tron Full Node.
Deploy Prometheus Service
Prometheus officially provides precompiled binaries and Docker images. You can download them directly from the official website or pull the images from Docker Hub. For more detailed installation and configuration instructions, please refer to the Prometheus documentation. For this guide, we will use Docker for a simple deployment:
-
Install Prometheus
After installing Docker, enter the following command to pull the Prometheus image:
docker pull prom/prometheus -
Prepare the Prometheus configuration file
The following is a Prometheus configuration file template
prometheus.yaml:global: scrape_interval: 30s scrape_timeout: 10s evaluation_interval: 30s scrape_configs: - job_name: java-tron honor_timestamps: true scrape_interval: 3s scrape_timeout: 2s metrics_path: /metrics scheme: http follow_redirects: true static_configs: - targets: - 127.0.0.1:9527 labels: group: group-xxx instance: xxx-01 - targets: - 127.0.0.2:9527 labels: group: group-xxx instance: xxx-02You can use this template and modify the targets configuration item, which specifies the IP address and Prometheus port of your java-tron node(s). Save the file to a local directory, for example
/Users/test/deploy/prometheus/prometheus.yaml. -
Start a Prometheus container
Start a Prometheus container with the following command, mounting the configuration file from the previous step (
/Users/test/deploy/prometheus/prometheus.yaml):docker run --name prometheus \ -d -p 9090:9090 \ -v /Users/test/deploy/prometheus/prometheus.yaml:/etc/prometheus/prometheus.yml \ prom/prometheus:latestAfter the container starts, you can view the running status of the Prometheus service at
http://localhost:9090/.Go to "Status" -> "Configuration" to verify that the container is using the correct configuration file:

Click "Status" -> "Targets" to view the status of each monitored java-tron node:
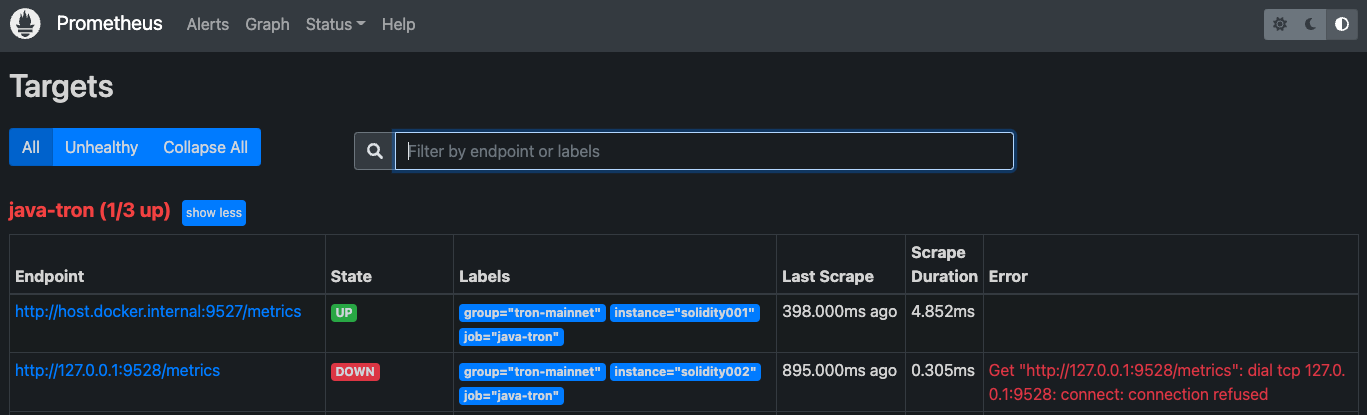
In the example above, the status of the first endpoint is UP, meaning Prometheus can successfully fetch data from the node. The second endpoint shows DOWN, indicating an error (hover over the error label for details).
When the status of the monitored java-tron nodes is normal, you can monitor the metrics through visualization tools such as Grafana. This article will use Grafana to display the data:
Deploy Grafana
The deployment process of the Grafana visualization tool is as follows:
-
Install Grafana
Please refer to the official documentation to install Grafana. This article uses the Docker image deployment, pulling the open source image (
grafana-oss):docker pull grafana/grafana-oss -
Start Grafana
You can use the following command to start Grafana:
docker run -d --name=grafana -p 3000:3000 grafana/grafana-oss -
Log in to the Grafana web UI
After startup, log in to the Grafana web UI at
http://localhost:3000/. The default username and password are bothadmin. After login, change the password according to the prompts, and then you can enter the main interface. Click the settings icon on the left side of the main page and select "Data Sources" to configure Grafana's data sources:
Enter the IP address and port of the Prometheus service in
URL: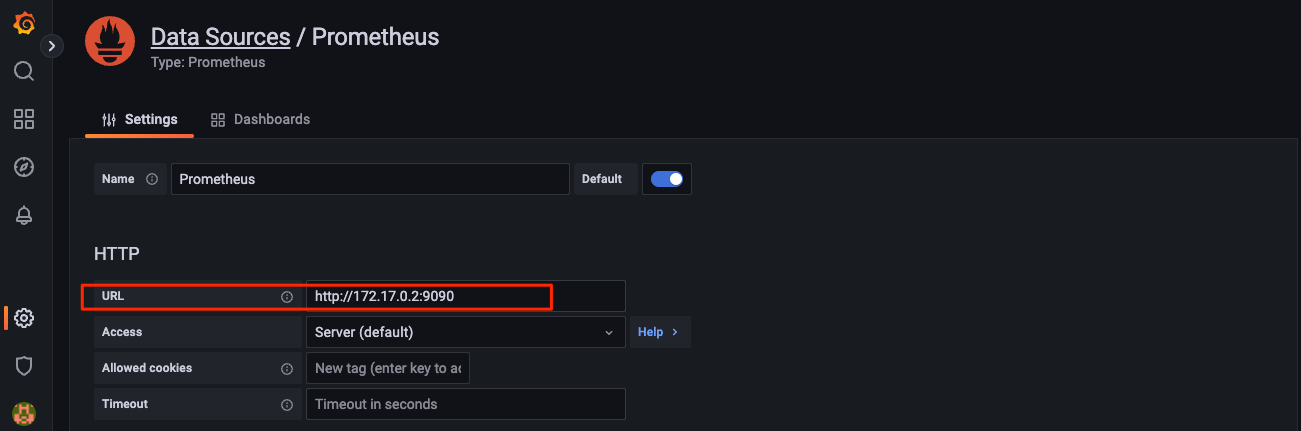
Click the "Save & test" button at the bottom of the page. Grafana will test the connection, and if successful, a 'Data source is working' notification will appear.
-
Import Dashboard
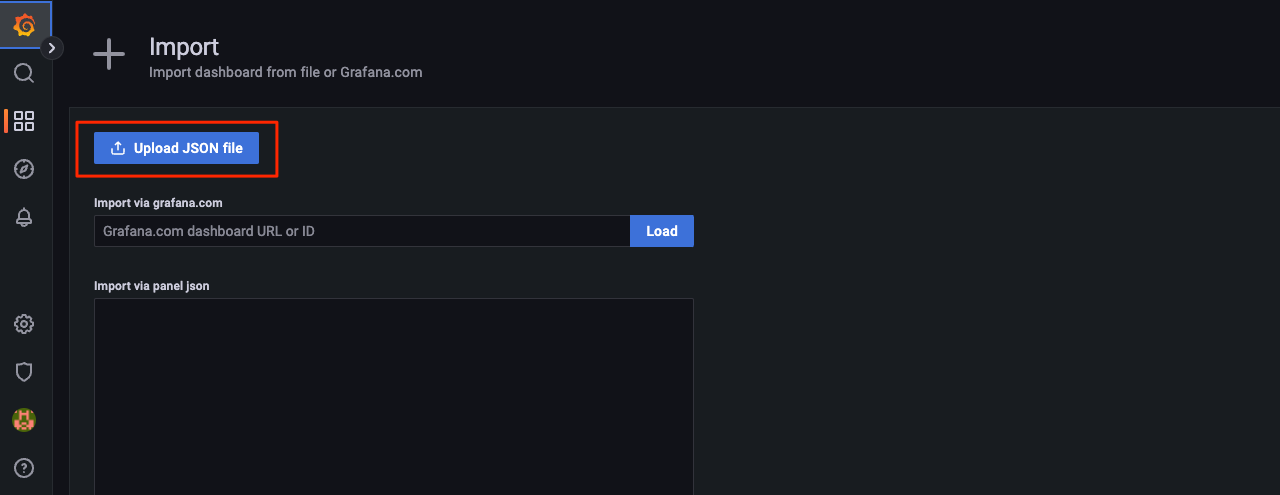
For the convenience of java-tron node deployers, the TRON community provides a set of pre-configured Grafana dashboards, each provided as a JSON file. Refer to the Import dashboard section of the tron-docker metric_monitor README to import them into Grafana.
Click the Dashboards icon on the left, then select "+Import", then click "Upload JSON file" to import one of the JSON files mentioned above:
Grafana will then render the dashboard according to the imported JSON file, allowing you to monitor the running status of the node in real time.